
On this Father’s Day I thought it would be appropriate to deal with a topic that highlights fathers, so for this article we’ll be looking at Y Chromosome Adam. (Sorry ladies, with the tragedy last month all eyes were focused there. But I’ll come back to a topic for moms either next article or next mother’s day).
Correcting the Record
“Y Chromosome Adam” actually originated as a concept out of secular genetics. According to the secularists:
“By analyzing DNA from people in all regions of the world, geneticist Spencer Wells has concluded that all humans alive today are descended from a single man who lived in Africa around 60,000 years ago.”[1]
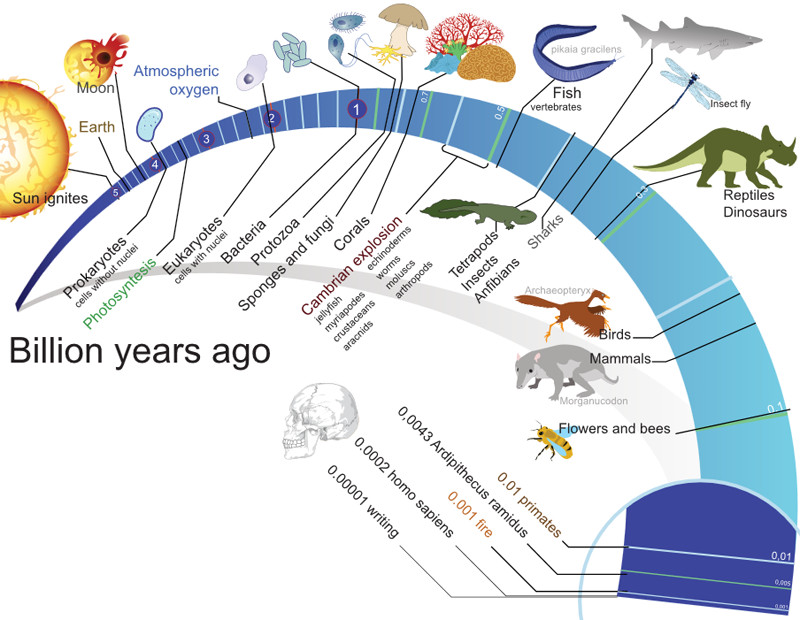
With secularists believing that modern humans appeared some 200,000 years ago, the time estimate was pushed back to that earlier period by some as indicated in this Wikipedia article. The older age is consistent with typical evolutionary timelines such as this one which show modern man emerging about 200,000 years ago.
But a closer examination of the human Y chromosome leads to startling, even alarming, conclusions for secularists but expected conclusions for those who support the Bible. Specifically, study of the human (male) Y chromosome confirms these two facts:
- The human Y Chromosome is young – within the 6,000 year time frame indicated by the Bible – not 60,000 years and particularly not 200,000 years.
- Due to the genetic entropy apparent in all genetic information (not just the Y chromosome) it is clear that human life began with a set of “perfect” genetic information that has been deteriorating and degenerating since its inception. With every generation, due to mutations, the gene pool has been getting increasingly corrupted, less efficient and less fit for survival. This is the exact opposite of what neo-Darwinian evolution predicts and needs to work. Since the gene pool is degrading it is impossible for it to have evolved from something simple. Whatever it is claimed life started from would also immediately start degrading, so there could be no gradual evolution from the simple cell to the complex human creatures (homo sapiens) that neo-Darwinian dogma requires.
While there is much more that can be said about it from a biblical creation standpoint, these two points both individually and together refute the entire neo-Darwinian paradigm and theory. Let’s take a look at the evidence that shows that Y Chromosome Adam points to the biblical Adam who lived some 6,000 years ago and not some secular old-age-compatible concept with a borrowed name that they’re trying to repurpose.
The Evidence: Y Chromosome Adam and Noah
Starting with the name, to be precise, biblical geneticist Dr. Rob Carter points out that actually the evidence we have today points to a Y Chromosome Noah. Why does he say that? Two things – one of which secularists ignore since they deny it – the global flood – and mutations. It is true that ultimately all Y chromosomes go all the way back to Adam. But keep in mind, mutations happen. Carter points out that, due to projects like the Thousand Genomes Project, we know the rate of mutations that occur in the Y chromosome:
“Because we can measure mutation rates from one generation to the next. In fact they’ve done a lot of genetic studies where they’ve sequenced the entire genome of two parents and their kid – a lot of them. And by doing that, you can measure how many mutations a child has that the parents don’t have. And with the rate that we measured, you should – we expect about one mutation, per Y chromosome, every generation. It doesn’t take many generations to get this sort of data.”[2]
Dr Rob Carter
From the below diagram we can see that Noah’s sons – the people who repopulated the earth after the flood – were 10 generations from Adam.
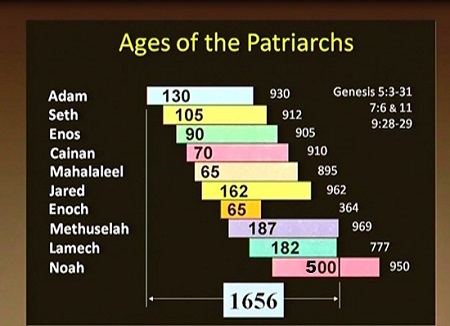
Patriarchs, Age when they had children, age at death, Year of the flood after creation (1656)
Additionally, Noah was 500 years old (Gen 5.32) when he began having children, and we know that as people age, they accumulate more mutations due to the many cellular divisions that occur over time. So in addition to the mutations Noah inherited from his forefathers, his sons may have inherited even more than the average since Noah was comparatively old when he starting having children. This means a number of difference could have accumulated in the Y chromosome between Adam and Noah. Those variations between Adam and Noah would have been lost in the flood since those lines would not have continued after the flood. So technically speaking, when we look at the evidence from the genome available today, it all goes back to Noah. If there were variances between Noah and Adam, they were lost in the global flood.
Okay, so that’s a technicality – Y Chromosome Noah instead of Adam. Now let’s get to the heart of the matter. To start off, we need to understand a key principle that Carter identifies:
“The more rare a mutation is, the more recent it is.”[3]
Dr. Rob Carter
This actually makes sense and is easy to see. Let’s say in the process of ageing a person develops a mutation that no one else has. That would make his mutation unique – and thus rare – among the thousands of human genomes that exist. And obviously, since it occurred in his lifetime, it is a very recent and you will not find it any other human genome.
This leads to a corollary principle: if a mutation is common and wide spread, it must have occurred a long time ago.
“Now there’s some variants way out there towards 30%, some even closer to 50%. Those are ones that happened really early in human history. And they might separate like all Africans from all Europeans. Or all Europeans from all the Native Americans. Something like that. But there’s only a few. Most of them are young. Therefore the human Y chromosome is young. Very young. Not a hundred thousand years old.”[4]
And there we have the evidence for the first fact: the human Y chromosome is young. Mutations that are widespread and common, like those he mentioned, happened early – possibly even in the time of Noah since he was so old when he had children.
To narrow the timeline a bit more, Carter points out that only a relatively few mutations and generations are needed compared to what secularists expect:
“We’re not talking about 10,000 mutations, we’re talking about a few hundred mutations in a few hundred generations. Boom – that’s exactly the sort of time frame we’d expect.”[5]
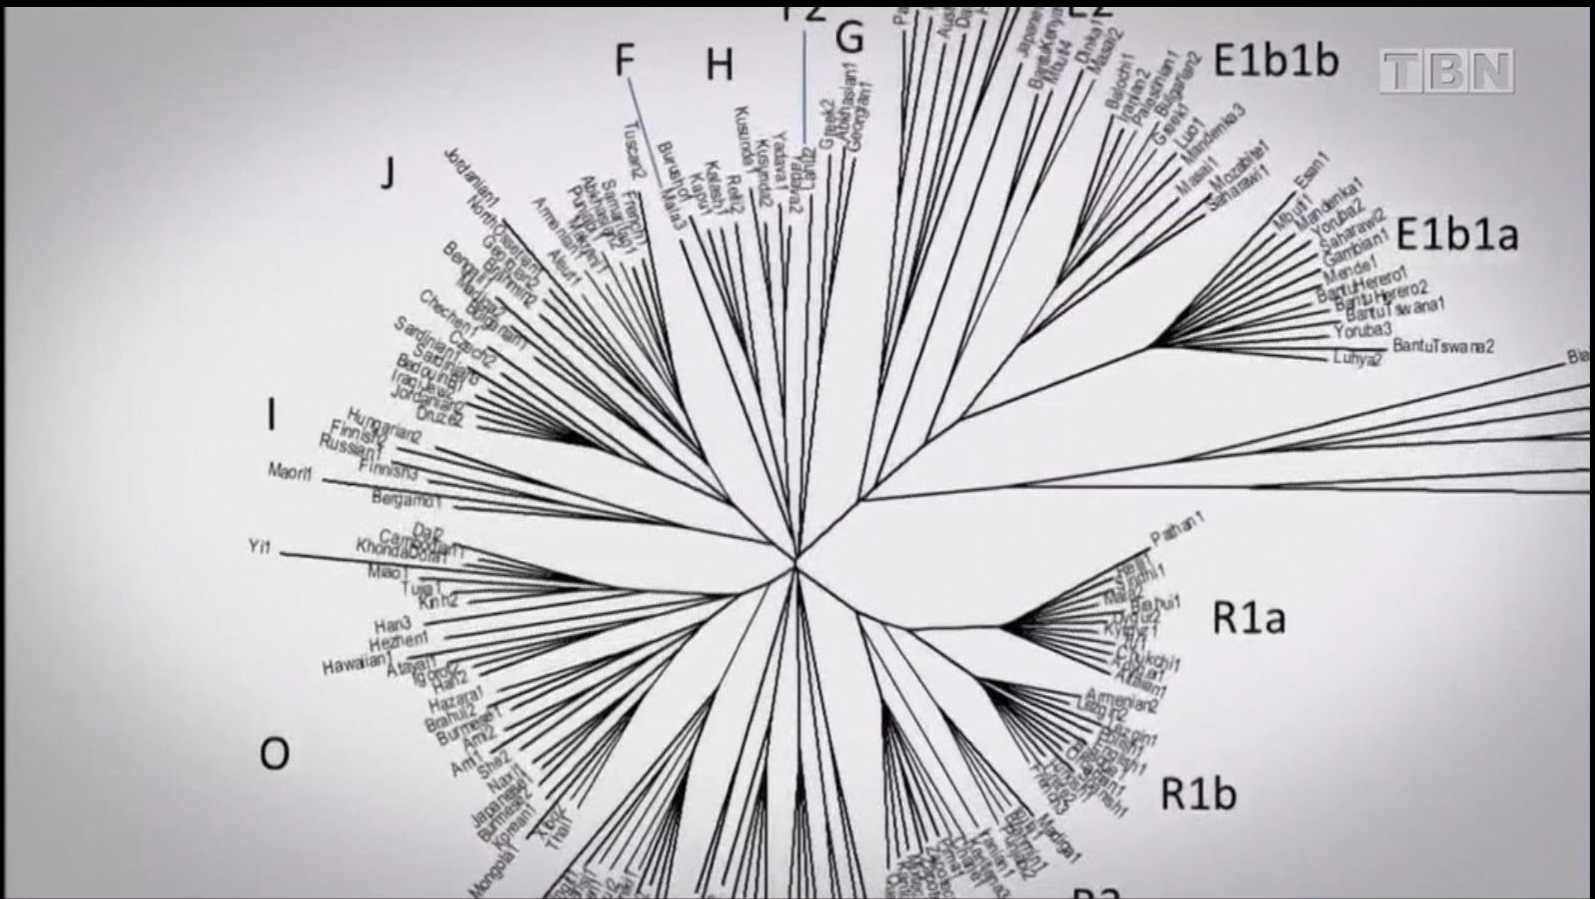
That time frame is further verified by work Carter did identifying every single mutation in the Y chromosome in the Thousand Genome project. He counted the differences (about 53,000 in the thousand Y chromosomes) and mapped them to make a family tree of the Y chromosome. Below is what the map of the human Y chromosome looks like – with all its variation. All the lines you see represent the number of mutations and their frequency. He couldn’t depict them all – they would be off the screen so he’s only showing about 4,000. But notice this: all the mutations point to, or originate from, a common origin. (That would be Noah.) And the vast majority of them are short lines – meaning they’re rare and thus recent. Here’s the chart:
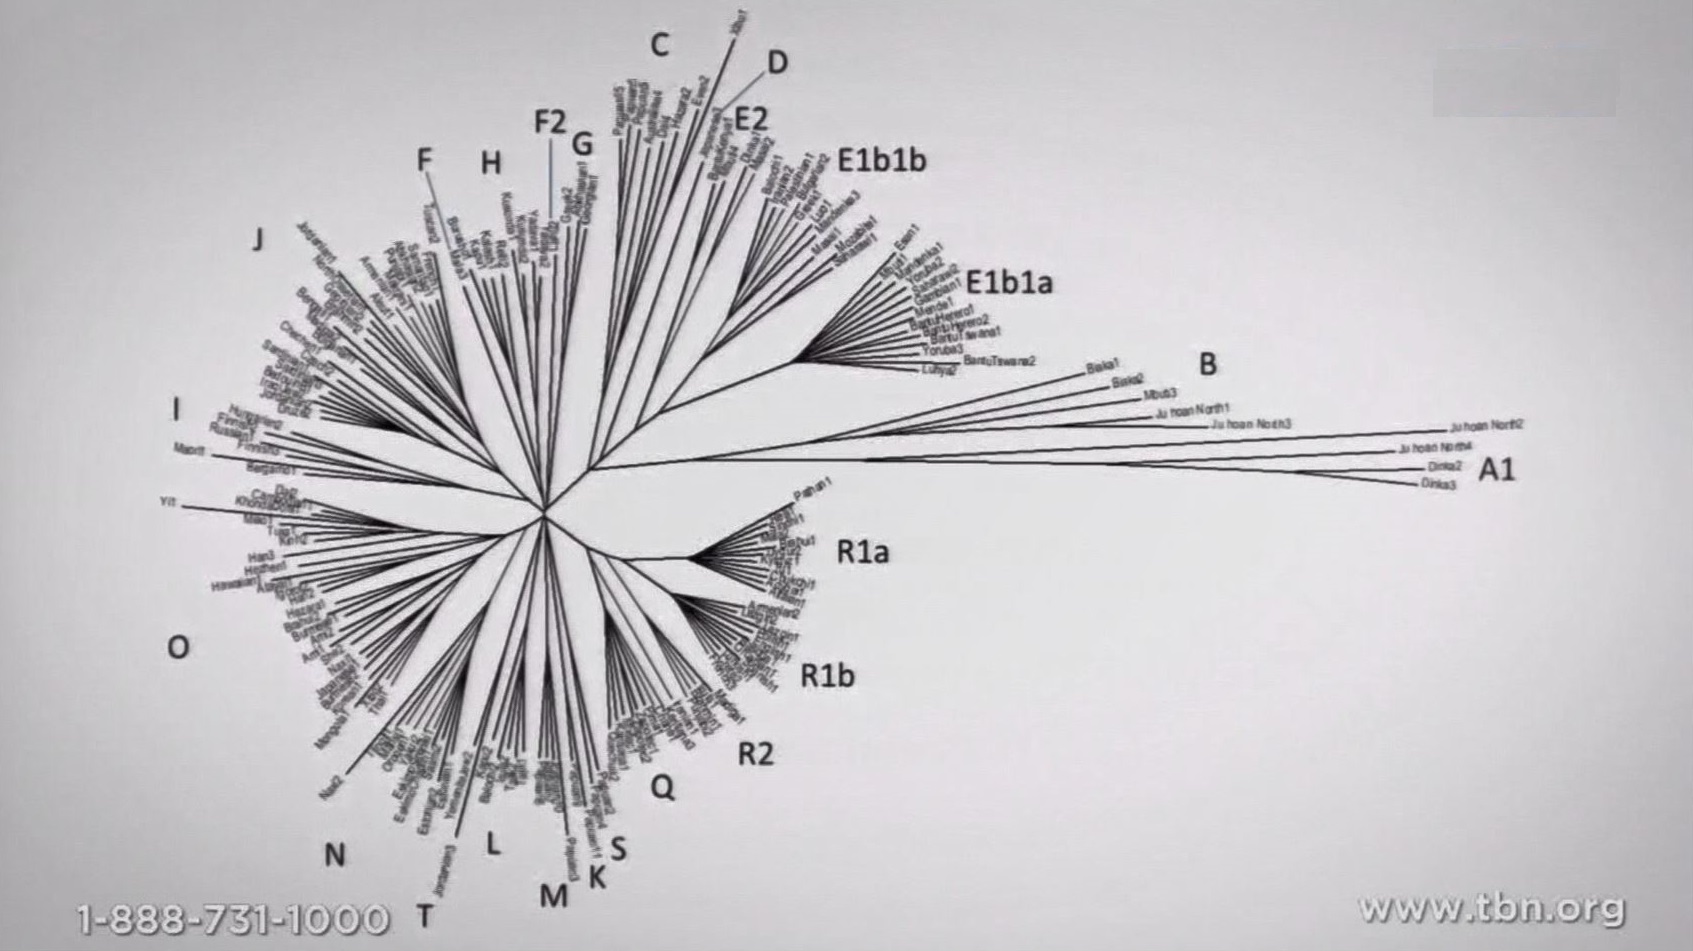
Again notice three things:
1. There are few long lines (which represent old mutations).
2. Most mutations have short lines, meaning they’re shared by few people and, therefore, recent.
3. All of these mutations are relatively recent and happened within the biblical time frame (the 4400 years since the flood) – with most being much more recent.
Carter goes on to make a number of other points that I won’t elaborate here. The only thing I will point out is that those lines all represent people groups and, so you can get a better look, below are links to a slightly larger section of the graph of the various groups who descended from Noah’s three sons:
Shem – (Includes the Jewish people) represented on the left
Ham – represented on the top right
Japhepth – represented on the bottom.
If you look closely, the names of the people groups are legible. This is further confirmation this is real, accurate data.
Genetic Entropy Demonstrates Neo-Darwinism is Impossible
Darwin didn’t know about genetics and mutations because he published before Mendel. So they are not included in his original theory. Mutations were added later and are now the driving force for the needed change in genetic information to bring about new traits and supposedly new species and kinds. With the addition of mutations Darwin’s original theory is now referred to as neo-Darwinism. According to neo-Darwinism, mutations are the driving force for the change in genes that natural selection can then operate upon to allow the survival of the fittest. The problem with this is two fold:
1. As geneticist Georgia Purdom points out here, there are no “good” or “bad” mutations. The difference is really the effect of the mutation. Are the outcomes good or bad?
Since the information encoded in a single strand of DNA can encode for numerous things, almost all mutations bring bad or deleterious effects. Research has shown that DNA can be read forwards, backwards, and a number of other ways to produce different protein outcomes from the same segment of DNA. Thus any change destroys the highly complex encoding built into DNA by the master designer.
2. Natural selection can only remove really bad mutations. It can’t add new information and it can’t get rid of most of the mutations with deleterious effects because the change is too small for selection to act upon.
A program called Mendel’s Accountant can be used to program and model the effects of mutations on a given population of creatures. Below are two charts that drive home the point.
This first chart shows that mutations accumulate and thus grow over time. Natural selection works as a preserving force for a population to get rid of the worst mutations that produce very bad deleterious effects but most mutations are below the selection threshold. The change is too small to make a difference and, because natural selection cannot remove it, it remains in the genome.
Carter pointed out they’ve determined there is one mutation in the Y chromosome every generation. That’s for one chromosome. Humans have 23 pairs. Across all pairs of chromosomes the number of mutations is closer to 100 per generation.
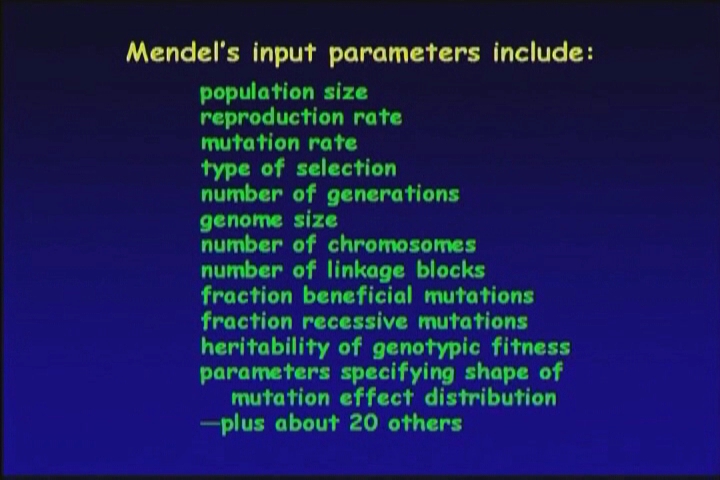
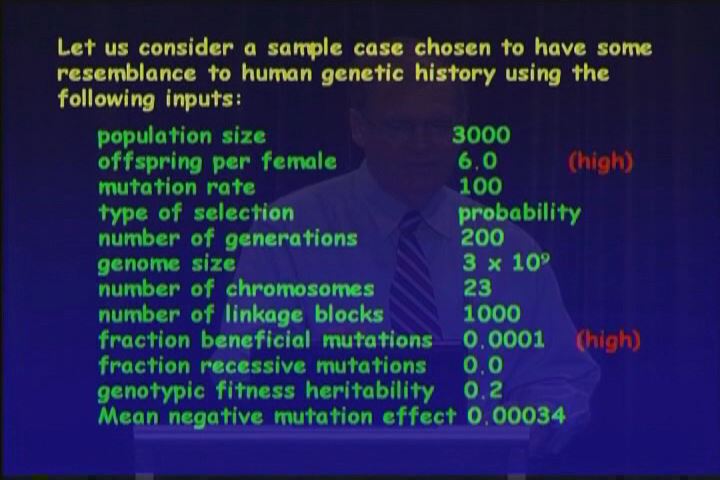
Dr John Baumgardner is recognized as a leading authority in computational models due to his creation of the most sophisticated computational model that depicts in 3D the earth’s mantle and enables modeling of catastrophic plate tectonics. The program is known as Terra. Below, Dr. Baumgardner[6] shows the output from Mendel’s Accountant, a computational model which is used to depict results based on the laws of genetics and various inputs such as population size, number of generations and mutational rates.
Here are the typical data inputs fed into Mendel’s Accountant. Here are the inputs used to create the charts below. These inputs are based on known human genetic history. The following is a graph of the growth of mutations in the human genome.
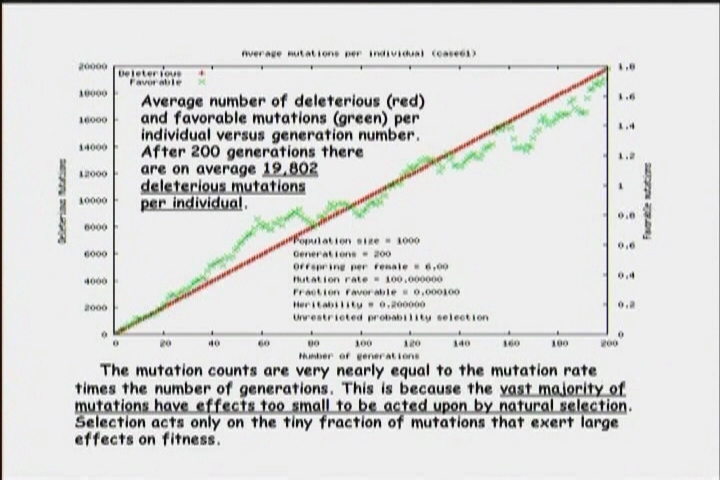
Average Mutations Per Individual
To Clarify:
- The left scale measures deleterious mutations and tops off at 20,000.
- The right scale measures beneficial mutations and tops of at 1.8. Yes, that’s it. Less than two in 200 generations.
- The bottom scale is time measured in generations, going from zero to 200.
- The red line is the (accumulating) deleterious mutations (read from the left scale, 0-20,000)
- The green line depicts beneficial mutations (read from the right line, 0-1.8).
What this graph is showing is that in 200 generations, with a mutation rate of 100 mutations per generation, there are an average of 19,802 accumulated bad/deleterious mutations per individual and fewer than two good mutations. Clearly the genome is deteriorating. It is not getting better. It’s also clear that there are not enough good mutations to drive any sort of changes, whether at the species level or the genus level.
What’s the result of the increasing mutations? It is decreasing fitness, as depicted in the following graph.
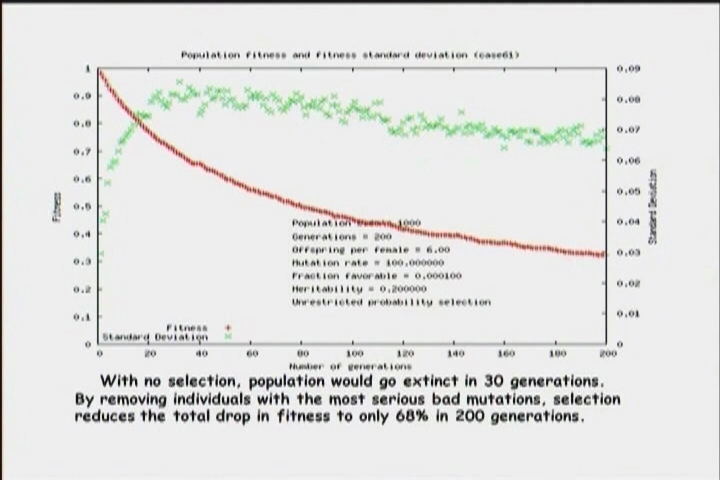
Population fitness and fitness standard deviation
This graphs depicts:
- Perfect fitness (left top=1)
- Standard Deviation (.01 – .09)
- Number of generations (0-200)
The red line depicts the decreasing fitness. The green line depicts standard deviation (from the number of mutations per generation).
Notice there is very little deviation in any given generation. Meaning, as the top graph depicts, all members of the population are effected by the growing number of mutations every generation. As the generations increase, the mutations also increase, which decreases the overall fitness of the population. You’ll note the graph is still trending downward even at the far right side, meaning eventually genetic entropy will lead to extinction of that population. This is among the most devastating of facts leveled against neo-Darwinism. Clearly mutation plus natural selection does not lead to new features and new creatures. It leads to less fitness and eventual extinction.
Conclusions
The only question from the fitness graph is, where did the original perfect fitness (1 at the top left) come from? It had to have come from an original perfect design which could only have come from a perfect designer.
With regards to Y Chromosome Adam – or Noah if you want to be precise – it is clear the bulk of the mutations are recent. This means the human Y Chromosome is recent and young, not hundreds of thousands or even tens of thousand of years old. It is clear the human Y genome is less than 10,000 years old which fits into the 6,000 year biblical time frame.
This is further evidence that our heavenly father started with our first father – Adam – recently. Scripture tells us that, after the fall of the first Adam, God sent the last Adam to redeem all mankind. (1 Cor 15.45) Rejoice that God has not left us alone or to our own devices. As a perfect father does, he loves his children and desires all would come to him. He has made a way for all to come to him through the last Adam, Jesus. If you haven’t already, why not do it this Father’s Day?
Taste and see that the LORD is good; blessed is the man who takes refuge in him.
(Psa 34:8)
Duane Caldwell | June 19, 2022 | Printer friendly version
Follow @rational_faith_
Notes
1. “Y-chromosomal Adam”, Familypedia, accessed 6/17/22,
https://familypedia.fandom.com/wiki/Y-chromosomal_Adam
Back
2. Rob Carter ref. from Creation in the 21st Century, episode “Y Chromosome Adam”, Documentary, 2019
Back
3. Carter, “Y Chromosome Adam”
Back
4. Carter, “Y Chromosome Adam”
Back
5. Carter, “Y Chromosome Adam”
Back
6. John Baumgardner demonstration from “Models, Genes and Global Warming“, CMI DVD, 2009
Back
Image
Noah at Desk – as depicted at The Ark Encounter, KY photo by Duane Caldwell © 2017